· Tools · 6 min read
Using the Chrome DevTools Network Tab Effectively
How to get real answers out of the Network tab — filtering 404s, filtering by domain, excluding noise, finding slow and heavy requests, copying requests as cURL, and other everyday debugging tricks.
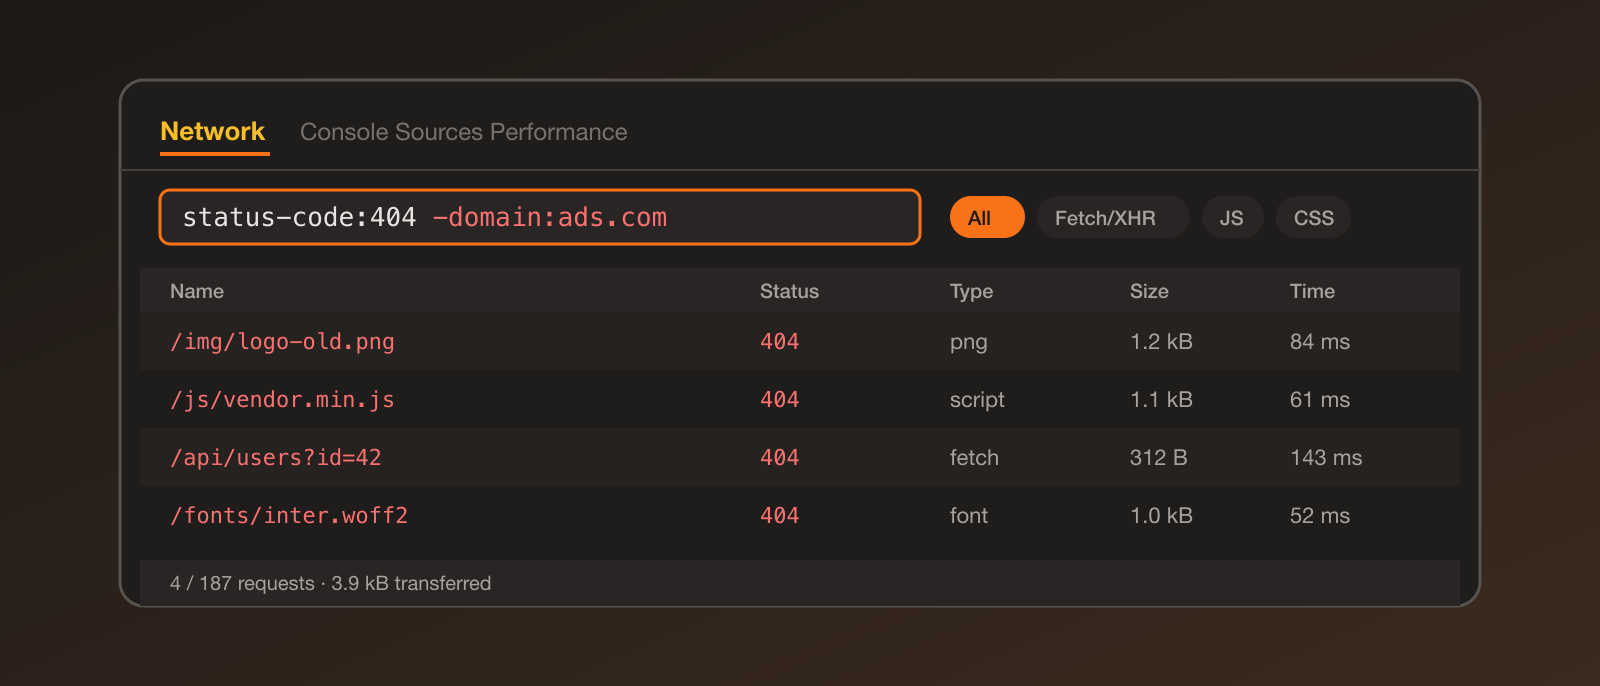
For a long time my use of the Network tab was: open it, see a wall of hundreds of requests, get overwhelmed, close it. Then I learned that it has a powerful filter box and a few settings, and suddenly it became the first place I look when something on a page is broken or slow.
Here are the features I actually use, with real situations where they help.
Opening it and getting set up
Open DevTools with F12 (or Cmd+Option+I on Mac, Ctrl+Shift+I on Windows/Linux) and click the Network tab. Requests are only recorded while DevTools is open, so open it first and then reload the page.
Two checkboxes worth turning on right away:
- Preserve log — keeps requests when the page navigates or redirects. Without it, the log clears on every page load and you lose the evidence.
- Disable cache — forces fresh downloads while DevTools is open, so you see what a first-time visitor sees.
The filter box is the main feature
The box at the top accepts plain text, which matches against the request URL. It also accepts properties in the form property:value, and you can combine several by separating them with a space.
| Filter | What it does |
|---|---|
status-code:404 | Only requests that returned a 404 |
domain:api.example.com | Only requests to that domain (* works as a wildcard, like domain:*.example.com) |
method:POST | Only POST requests |
larger-than:1M | Only responses larger than 1 MB (also accepts bytes, like larger-than:500000) |
resource-type:image | Only images |
mime-type:application/json | Only JSON responses |
has-response-header:set-cookie | Only responses that set a cookie |
is:from-cache | Only requests served from cache |
scheme:http | Only plain HTTP (useful for spotting mixed content) |
Put a minus sign in front to exclude instead:
-domain:google-analytics.com
-resource-type:image
-status-code:200
You can also use a regular expression by wrapping the pattern in slashes, like /\.(png|jpg)$/.
Start typing a property name and DevTools shows an autocomplete list, so you don’t need to memorise these.
Real-world use cases
1. Finding broken requests (404s and other errors)
A page looks wrong, an image is missing or a script isn’t loading.
status-code:404Every failed resource is listed with its full URL, so you can spot a typo’d path or a missing file straight away. Try status-code:500 for server errors, or -status-code:200 to see everything that wasn’t a plain success. Rows with failed requests are also shown in red, so you can scan for those even without a filter.
2. Looking at one domain only
You’re debugging calls to your own API among dozens of other requests.
domain:api.myapp.comOr, for the reverse, check what a page loads from a third party:
domain:*.googletagmanager.com3. Excluding the noise
Analytics, ads and fonts can bury the requests you care about. Subtract them:
-domain:*.google-analytics.com -domain:*.doubleclick.net -resource-type:fontThere is also a 3rd-party requests checkbox in the filter bar, which hides everything from other domains in one click, and an Invert checkbox that flips whatever filter is applied.
4. Debugging an API call
Click the Fetch/XHR button in the type row to show only API calls, then click a request. The tabs on the right show:
- Headers — the URL, method, status, and request and response headers.
- Payload — what your code sent.
- Preview / Response — what came back, formatted for JSON.
- Timing — where the time went.
If your page shows “something went wrong”, the real error message is usually in the Response tab of the failed call.
5. Reproducing a request outside the browser
Right-click a request → Copy → Copy as cURL. You can paste it in a terminal to replay the exact call, or into a bug report so a teammate can reproduce it. There are also Copy as fetch and Copy as PowerShell options.
Be careful: the copied request can include cookies and auth tokens, so remove them before sharing it.
6. Finding what makes a page slow
- Sort by Size or Time by clicking the column headers, or filter with
larger-than:500kto find heavy files such as unoptimised images. - Open a request’s Timing tab. A long Waiting for server response (TTFB) means the backend is slow. A long Content Download means the file is too big.
- The Waterfall column shows the order requests happen in, so you can see what blocks what.
- Check the status bar at the bottom for total requests, data transferred and load time.
7. Testing bad connections
Use the throttling dropdown (it says “No throttling” by default) to switch to Slow 4G or Offline. This is a quick way to see how your page behaves for users on poor connections, and whether it fails gracefully with no network.
8. Checking caching
Filter with is:from-cache to see what’s reused between loads. For a given request, check the Size column: it says “(disk cache)” or “(memory cache)” when it didn’t hit the network. Remember to untick Disable cache if you want to test real caching behaviour.
9. Tracking down redirects and cookies
With Preserve log on, filter with status-code:301 or status-code:302 to see redirect chains. To find which request is setting a cookie, use has-response-header:set-cookie.
10. Seeing what triggered a request
Open the Initiator column (right-click the column headers to add it). It shows which script and line made the request, which is handy for tracing mystery calls back to your code.
A few more useful tricks
- Search all responses: press
Cmd+F/Ctrl+Finside the Network panel to open the search drawer, which searches the content of every request and response, not just the URL. It’s great for finding which call returned a particular value. - Block a request: right-click → Block request URL to see how the page copes when an API or script fails.
- Replay an XHR: right-click a Fetch/XHR request → Replay XHR to send it again without reloading the page.
- Edit headers or responses: DevTools can override response headers and content locally, so you can test a fix without touching the server.
- Export a HAR file: use the download arrow in the toolbar to save the whole session. Teammates can open it later with the import option. HAR files can contain cookies and tokens, so share them carefully.
- Add columns: right-click the column headers to add things like Domain, Method, Protocol or Initiator.
My quick checklist
When something is wrong on a page, I open the Network tab, enable Preserve log, reload, and then:
- Filter
status-code:404(and-status-code:200) to spot failures. - Switch to Fetch/XHR to look at API calls.
- Check the Response tab of any red request.
- Sort by Time and Size if it’s a performance problem.
Most bugs are visible in the first couple of those steps.
Where to go next
- The official docs: Network features reference.
- Try the filters on a few sites you use and see how many third-party requests they make.
- Use Playwright to automate checks like “this page makes no failed requests”.
The Network tab looks overwhelming at first, but once you know a few filters it turns into a useful debugging tool.